October 27, 2026 Real Estate Market Update | Wheaton, DuPage County & Chicagoland
Weekly MRED Residential Market Snapshot
As October comes to a close, the latest Midwest Real Estate Data (MRED) figures show a mixed regional housing market: slightly more new listings than last year, fewer properties going under contract and closing, and a higher median sold price. For buyers and sellers in Wheaton, Glen Ellyn, Winfield, West Chicago, Naperville, and surrounding communities, these regional trends provide context, but property-specific decisions require local comparable sales.
Explore the official MRED Weekly Market Snapshot
At a Glance: October 19–26, 2026
Indicator | 2025 | 2026 | Year-over-year |
|---|---|---|---|
New listings | 4,760 | 4,853 | +2.0% |
Under contract | 2,443 | 2,241 | -8.3% |
Closed listings | 2,233 | 1,720 | -23.0% |
Median sold price | $325,000 | $344,950 | +6.1% |
Figures reflect the broader MRED residential market, not just Wheaton or DuPage County. Year-over-year changes are calculated from the values printed on the supplied MRED charts.
New Listings: Supply Is Slightly Higher
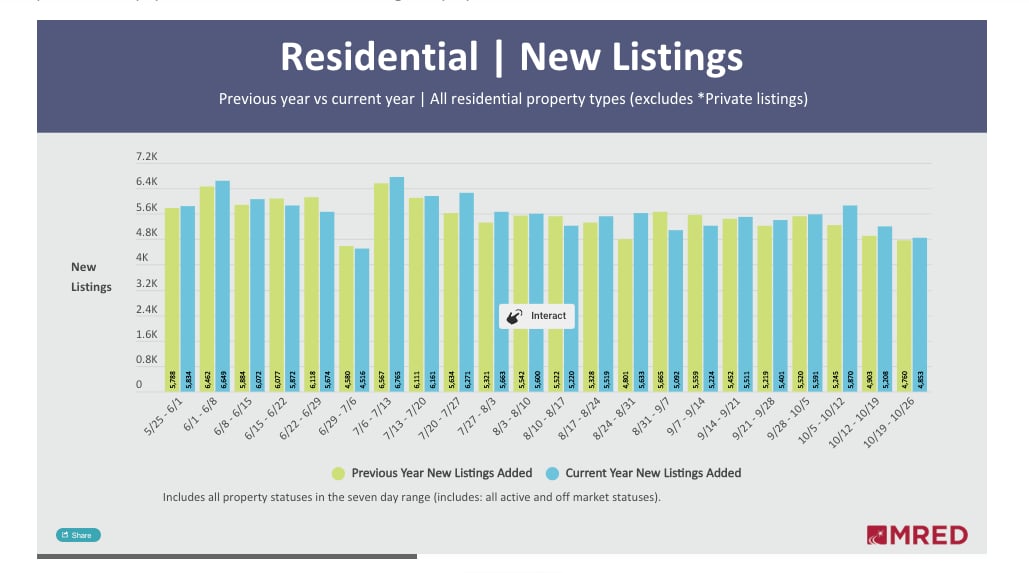
MRED recorded 4,853 new listings, compared with 4,760 in the comparable 2025 week, an increase of 2.0%. This measures new listings entering the broader MRED residential market, not the number of homes currently available in Wheaton. For sellers, accurate pricing and presentation remain important when buyers have more properties to compare.
Under Contract: Fewer New Contracts
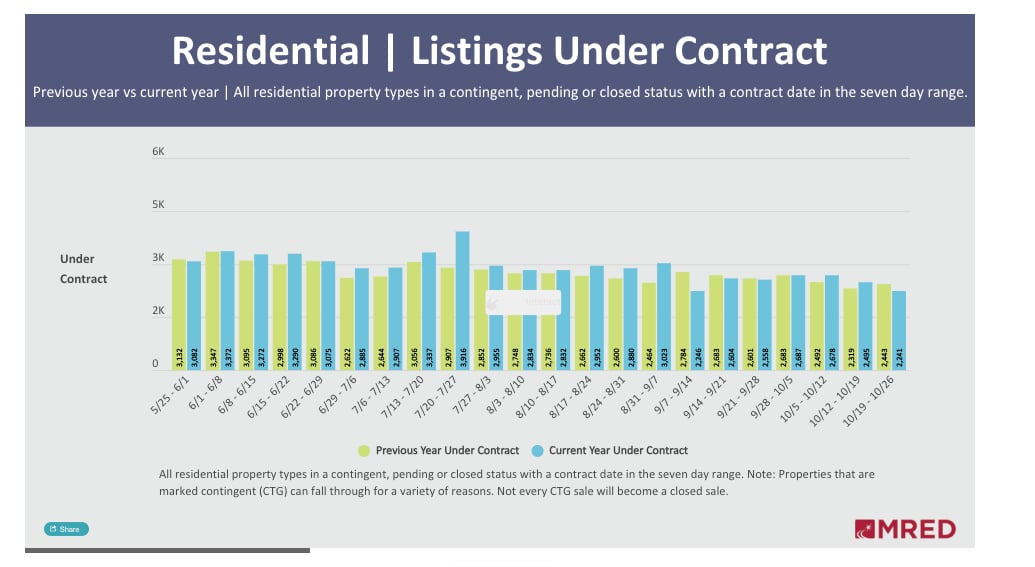
2,241 properties went under contract, compared with 2,443 a year earlier, a decline of 8.3%. Contracts offer a timely view of activity, but they are not guaranteed closings. Conditions can differ substantially by town, price point, and property type.
Closed Listings: Weekly Closings Declined
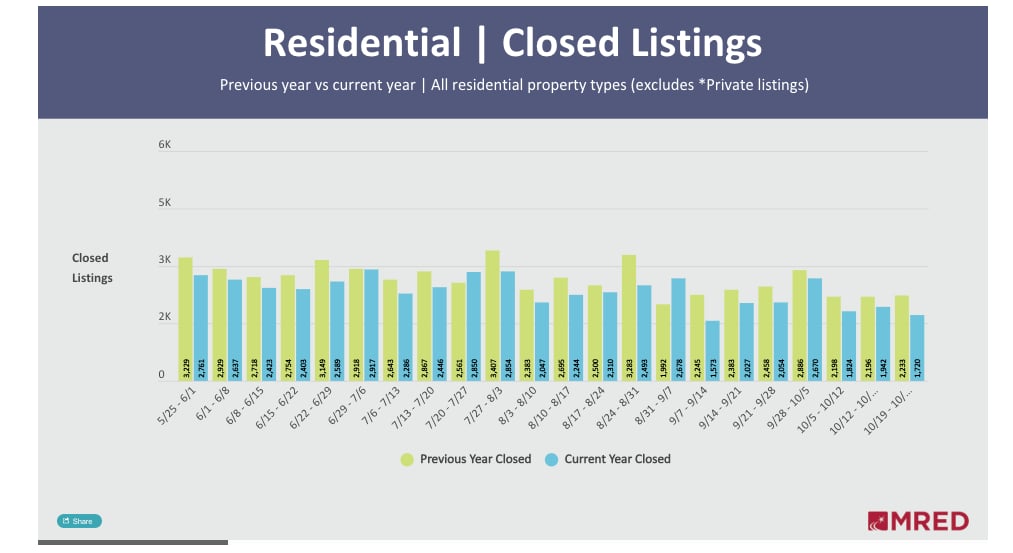
The chart shows 1,720 closed listings versus 2,233 in the comparable 2025 week, a decrease of approximately 23.0%. Weekly closings reflect contracts negotiated earlier and can be influenced by timing. This regional figure does not establish the rate of change in Wheaton home sales.
Sold Prices: Median Remains Higher
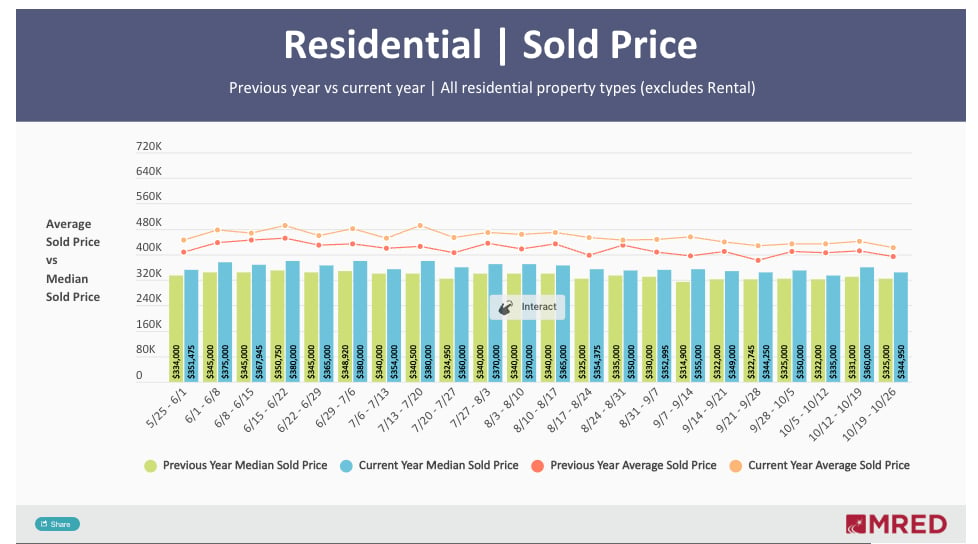
The median sold price was $344,950, compared with $325,000 in the comparable week last year, an increase of approximately 6.1%. A higher median does not mean every home appreciated 6.1%; the mix of properties sold also affects this measure. The report also charts average sold prices separately from medians.
Open Houses: 3,909 Reported
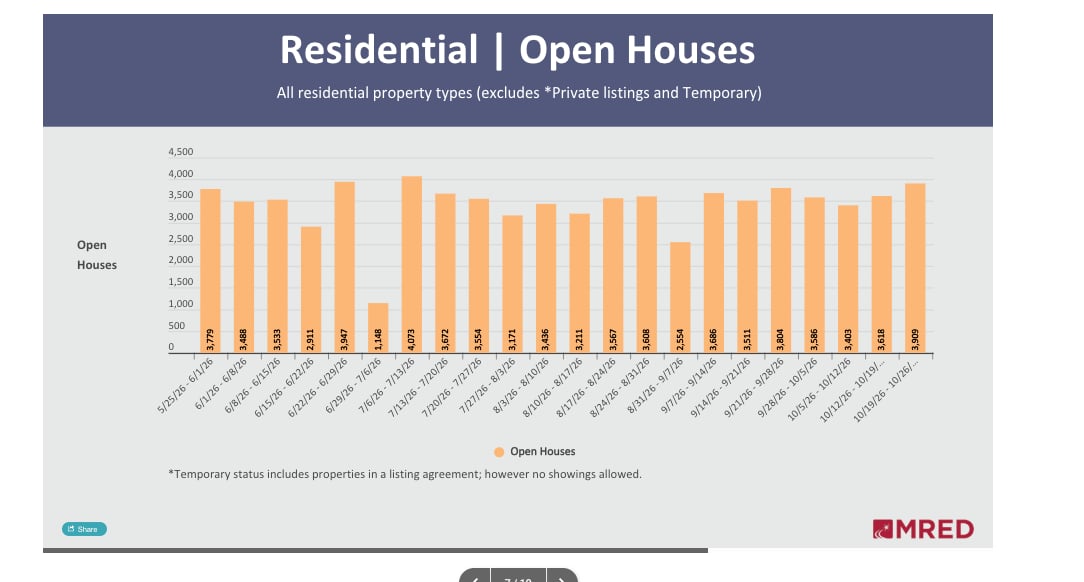
The report shows 3,909 open houses for the latest reporting week. This chart shows weekly open-house counts and does not provide a direct 2025 comparison. Open-house activity is one way to gauge marketing exposure, not a stand-alone measure of buyer demand.
Showing Activity: Seasonal Context
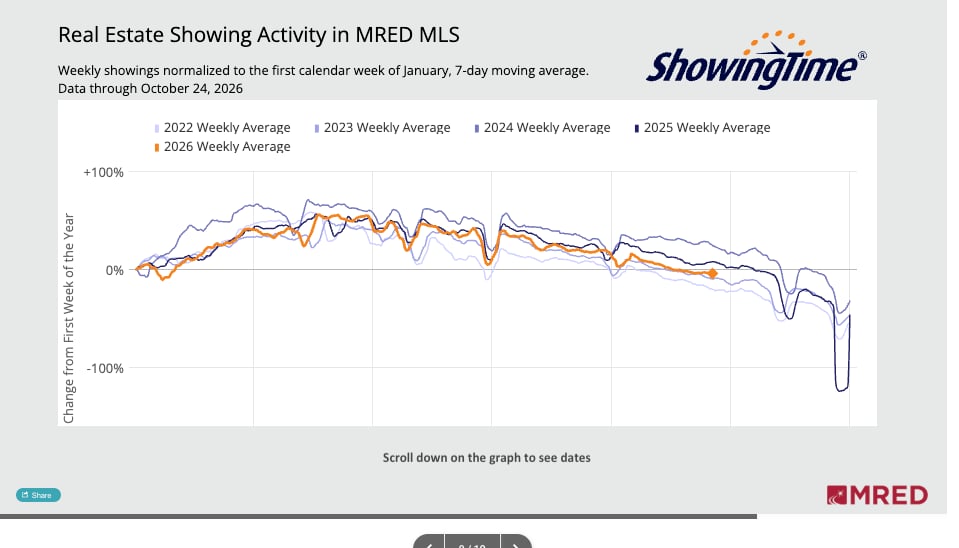
The ShowingTime chart tracks 2026 showing activity through October 24 against prior years, normalized to the first calendar week of January. It suggests activity has moderated from spring and summer levels. Because this chart uses an indexed baseline, it should not be read as the actual number of showings or as a precise percentage change in local Wheaton showings.
What This Means for Wheaton and DuPage County
Wheaton is not one uniform housing market. A detached home near Downtown Wheaton, a condo in Trees of Wheaton, and a luxury property elsewhere in DuPage County can face different competition and buyer activity. The most useful analysis considers recent nearby closings, current listings, property condition, above-grade square footage, and the price range buyers are actually shopping.
For Sellers
Review local comparable sales, prepare the home carefully, and price against current competition rather than assuming regional median price growth applies directly to your property.
For Buyers
Compare each home with recent neighborhood sales, consider total ownership costs, and evaluate how long similar properties are taking to secure a contract. A regional decline in contracts does not guarantee negotiating room on every listing.
Local Places That Make Wheaton Distinctive
Downtown Wheaton, the Illinois Prairie Path, Cantigny Park, and the Wheaton Metra station are among the area amenities buyers frequently consider. Neighboring communities such as Glen Ellyn, Winfield, West Chicago, and Warrenville offer different housing options and commute patterns.
About Joe Soto | Wheaton Real Estate Agent
I’m Joe Soto with RE/MAX Suburban and The Lance Kammes Team. With more than 13 years of residential real estate experience and over $200 million in individual career sales, I help buyers and sellers understand property values, compare local market activity, and build a practical plan for their next move.
Visit my real estate website | Read my real estate blog | Search homes on Zenlist | The Lance Kammes Team
Frequently Asked Questions
Are Chicagoland home prices rising in October 2026?
The MRED regional median sold price for the latest week was $344,950, up approximately 6.1% from the comparable week in 2025. This does not measure appreciation of individual homes.
Are fewer homes going under contract?
Yes, in the broader MRED market for this week: 2,241 versus 2,443 one year earlier. Local results may differ.
Are these statistics specifically for Wheaton?
No. They describe the broader MRED residential market. A Wheaton-only or DuPage County-only market analysis requires geographic filtering of MLS data.
How can I find out what my Wheaton home is worth?
A comparative market analysis uses recent comparable sales, property features, condition, square footage, and active competition to estimate a likely market range.
Final Thoughts
The October 27 MRED snapshot points to modestly higher new listing activity, fewer contracts and closings, and a higher median sold price than the comparable week last year. The best decision for any buyer or seller still begins with a close look at their own neighborhood and property type.
Joe Soto
RE/MAX Suburban | The Lance Kammes Team
(630) 599-8833
joesotodupagerealtor.com